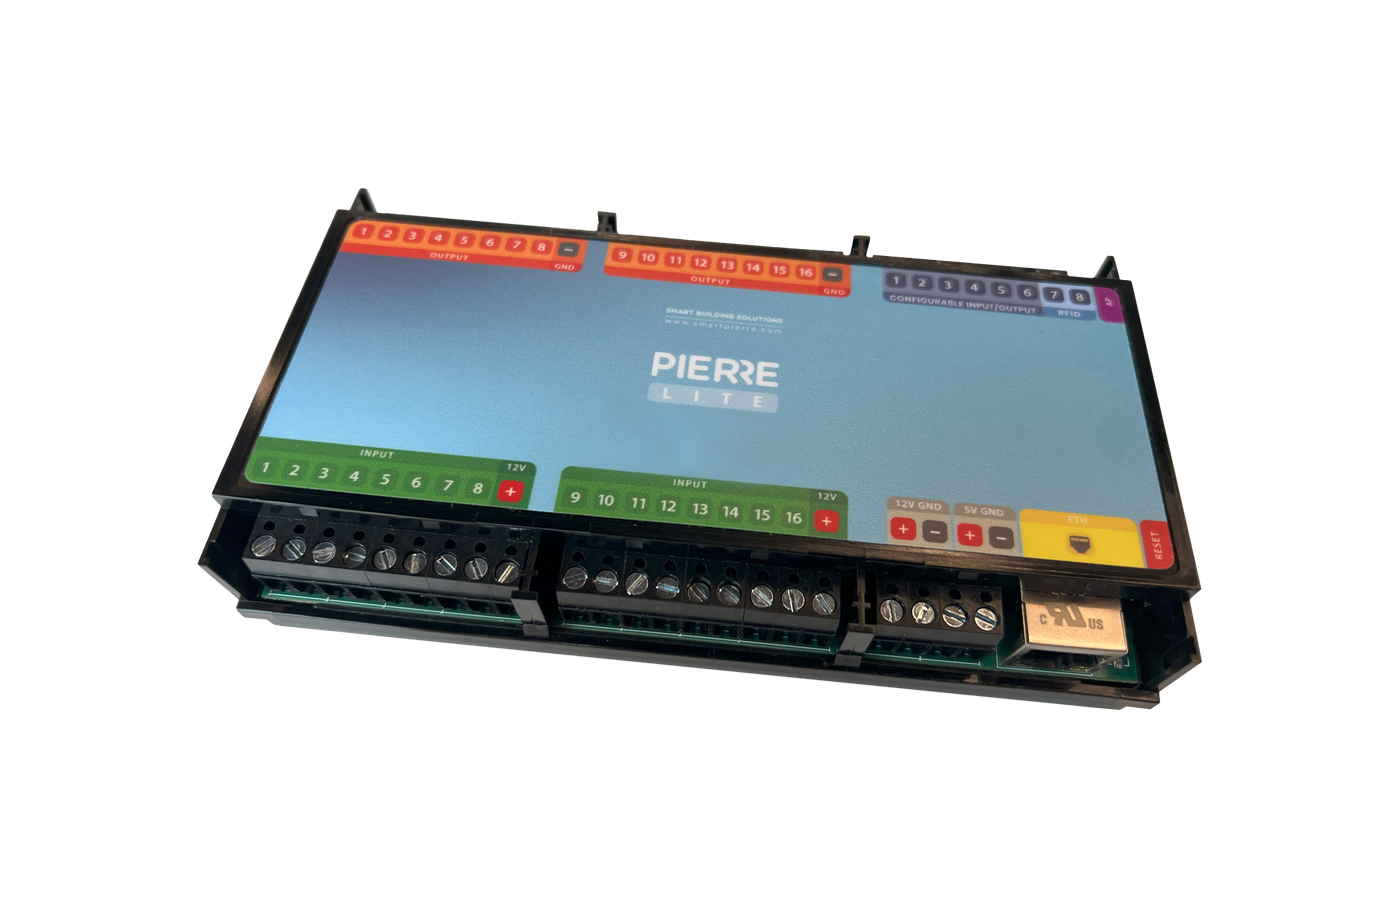
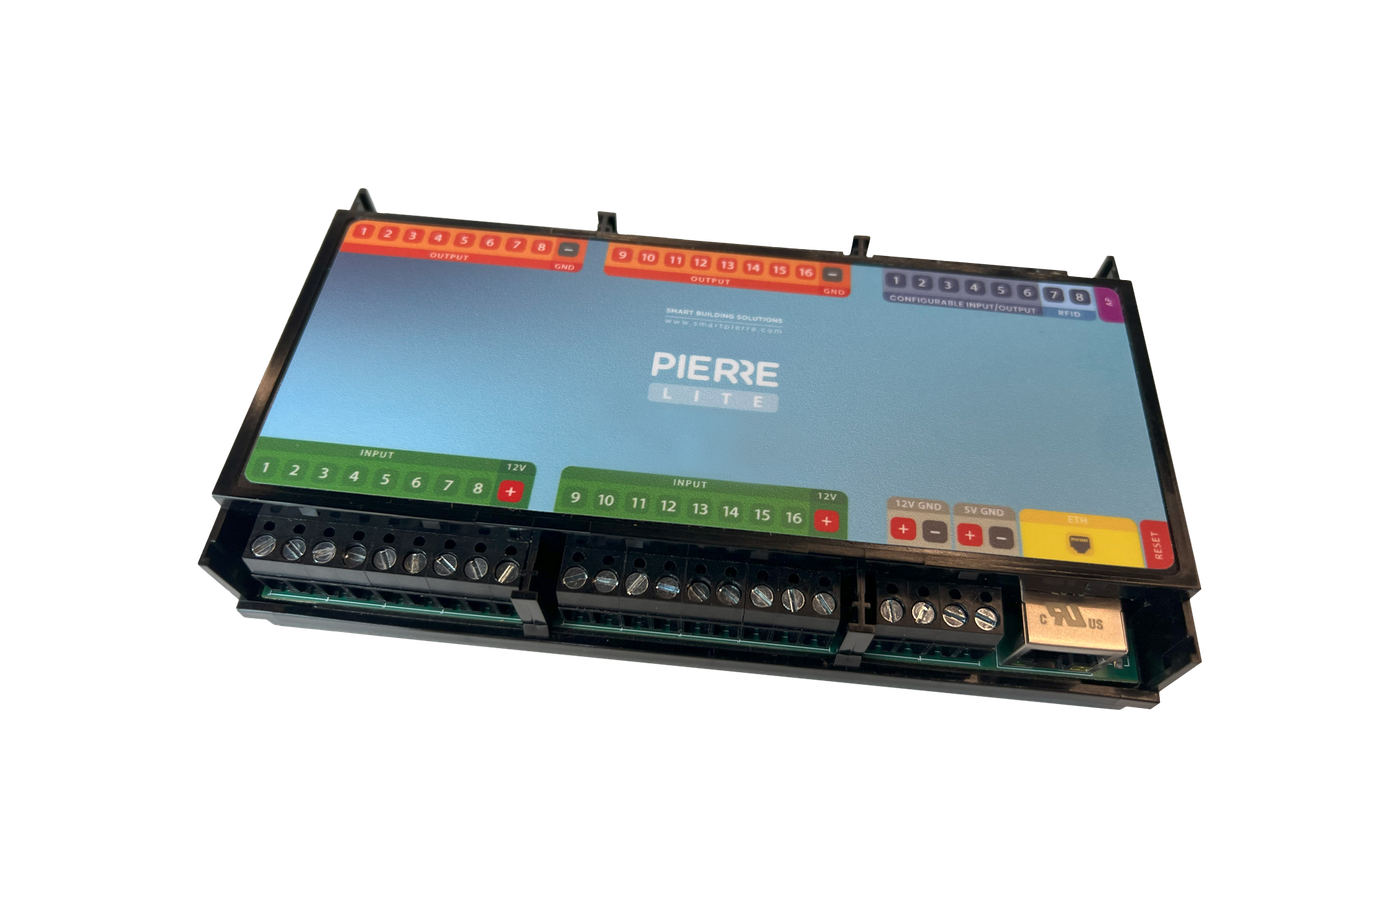
PIERRE Partner - Controller Informations
Description
The Controllers section of the PIERRE Partner App is used for commissioning, configuring, and monitoring all PIERRE Wired controllers within a building or project. It provides a centralized overview of controller status, connected devices, resource utilization, and maintenance functions.
Controller List
The controller list displays all controllers available within the selected building or system.
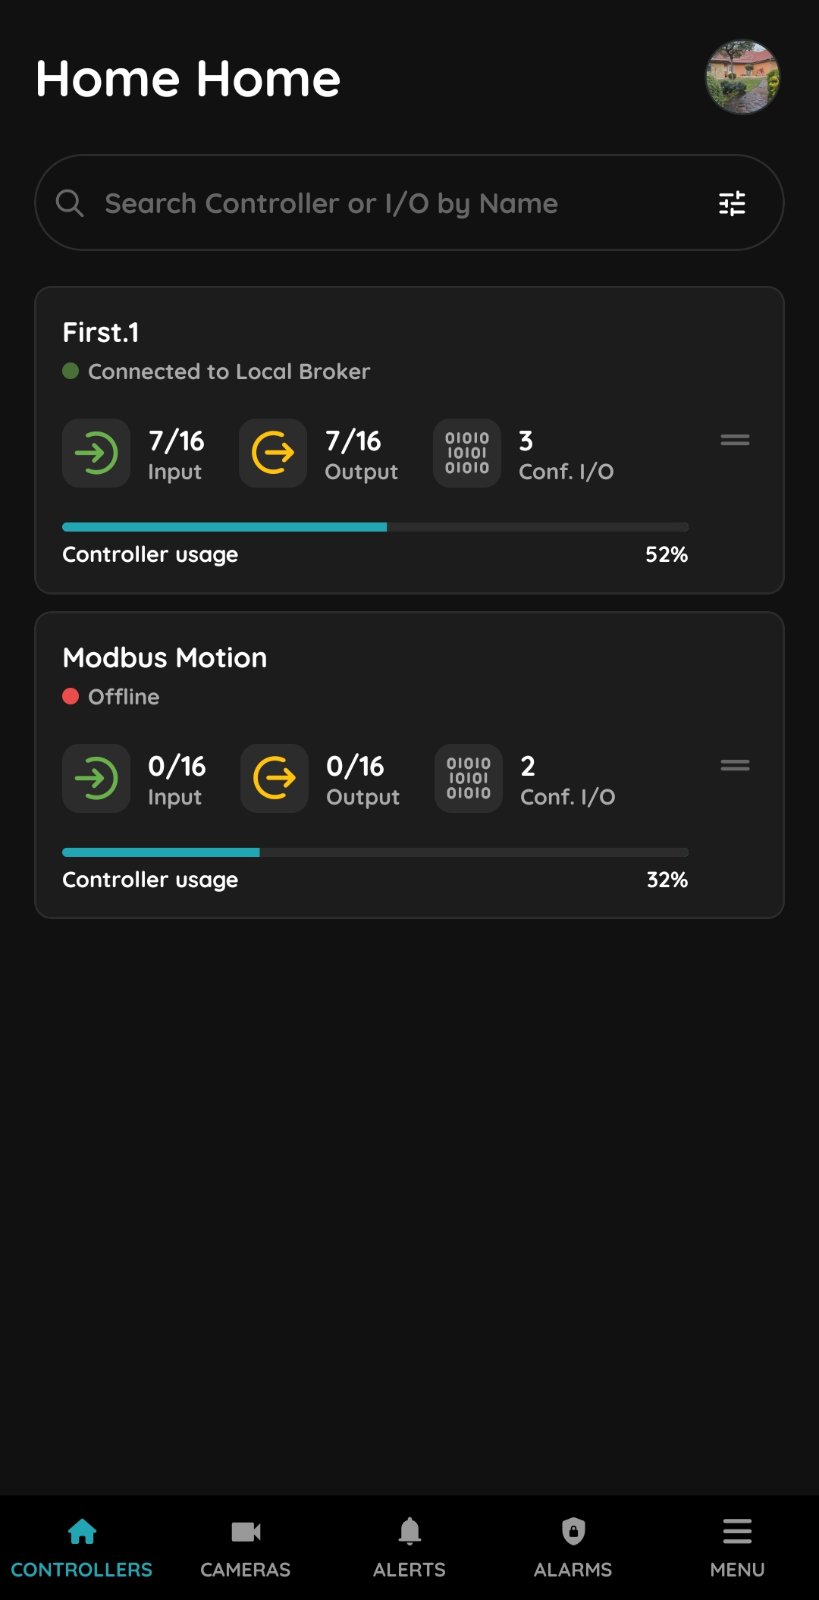
For each controller, the following information is shown:
-
Controller name
-
Number of configured Inputs
-
Number of configured Outputs
-
Number of Configurable I/O channels
-
Current connection status
-
Runtime memory usage
Controllers can be arranged in any preferred order to improve system organization. To reorder controllers, press and hold the drag handle (two parallel lines) on the right side of the controller card and move the controller to the desired position.
LED Status Indicator
The controller carries a status LED. Its colour tells you what the controller is doing, which is the quickest way to check a unit on site without opening the app.
The LED on the controller shows its current state:
| Colour | State | What it means |
|---|---|---|
| Green | Online | Connected to the network and operating normally. |
| Pulsing green | Connected to Local Broker | The controller is reaching the system through a local broker in the building. This is the only state that pulses. |
| Red | Offline | Disconnected from the network, or there is no internet access. |
| White | Commissioning | The controller has started in AP mode and is waiting to be commissioned. |
| Light blue | AP mode | The controller is broadcasting its own network for setup or configuration. |
| Dark blue | Selected in the app | This controller is the one currently selected in the PIERRE Partner app. Use it to identify the physical unit in the cabinet. |
| Purple | Searching for IP address | The controller is waiting for an address from the router. |
| Orange | Firmware update | An OTA update is running. Do not power the controller off while the LED is orange. |
Connection Status in the App
Separately from the LED, each controller card in the app carries a connection indicator in its upper-right corner, with a label beside it.
| Indicator | Label | Meaning |
|---|---|---|
| Steady green | Connected to Cloud Broker | The controller is reaching the system through the cloud broker. |
| Pulsing green | Connected to Local Broker | The controller is reaching the system through a local broker in the building. This is the only state that pulses. |
| Steady red | Offline | The cloud connection has been lost. |
The app distinguishes four connection states internally, but both disconnected states are shown the same way — steady red with the Offline label — so the label alone does not tell you which broker the controller was using. Any state the app cannot interpret is also shown as red.
Reading the two indicators together: the LED tells you what the controller itself is doing, and the connection indicator tells you how it is reaching the system. A controller with a white LED is not yet commissioned, so it will show as offline in the app until commissioning is finished.
Controller Configuration
Selecting a controller opens its detailed configuration page.
Available sections include:
Inputs
Configure and manage all input devices connected to the controller, including sensors, switches, and other signal sources.
Outputs
Configure output channels used for controlling lighting, HVAC equipment, shading systems, relays, and other connected devices.
Configurable I/Os
Configure channels that can operate either as inputs or outputs depending on project requirements.
Service
Provides access to controller-specific maintenance and diagnostic functions.
Additional Controller Options
Press and hold a controller card to access additional functions.
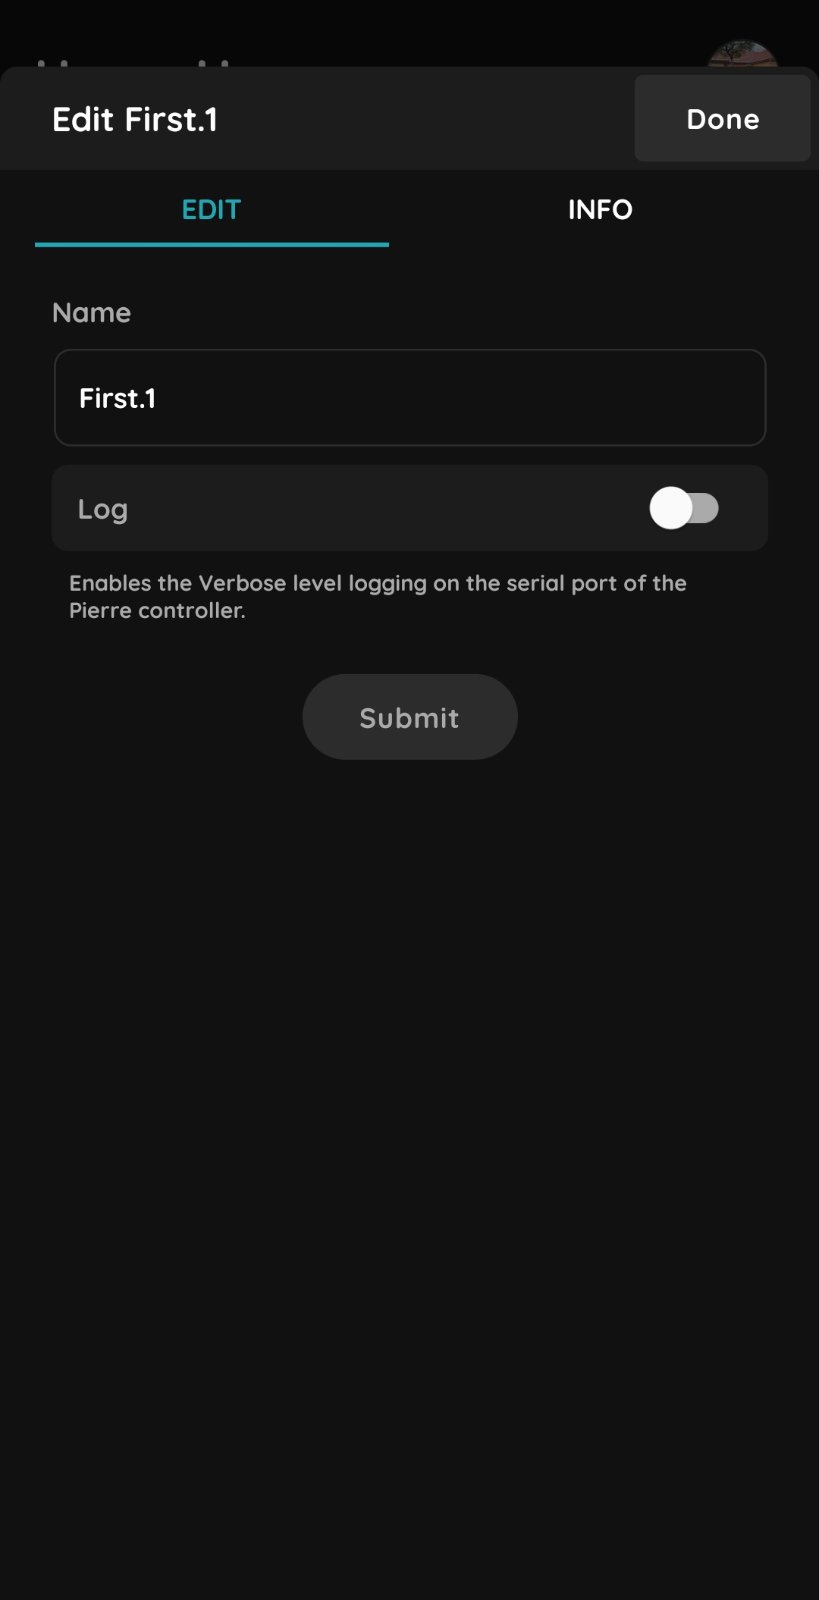
Edit
- Name - Allows modification of the controller name.
- Log - Enables verbose diagnostic logging through the controller's serial port. This feature is primarily intended for commissioning, troubleshooting, and advanced technical support.
Info
Displays controller information including:
-
Bridge Type (Controller)
-
Firmware Build Version
Controller Memory Usage
The Controller Usage indicator displays the current runtime memory utilization of the controller as a percentage from 0% to 100%.
This value represents the utilization of the controller's dynamic runtime memory (Heap).
The heap is used by the controller to allocate memory during operation for various services and processes.
Typical Activities That Increase Heap Usage
-
Creating and configuring Inputs and Outputs
-
Establishing network connections
-
Communication buffers for protocols such as Modbus
-
Automation and scenario execution
-
Logging and temporary data storage
-
Device management services
-
Graphic processing and display-related operations
When tasks are completed and resources are released, heap utilization may decrease accordingly.
Factors Affecting Heap Usage
Runtime memory consumption depends on several factors, including:
-
Number of connected devices
-
Active communication protocols
-
Quantity of configured I/Os
-
Automation complexity
-
Configuration size
-
Network traffic volume
-
Logging activity
Recommended Operating Range
| Heap Usage | Status |
|---|---|
| 0–50% | Excellent |
| 50–70% | Normal |
| 70–80% | Acceptable |
| 80–90% | Monitor Closely |
| Above 90% | Increased Risk of Instability |
| Near 100% | Memory Allocation Failures Likely |
For optimal long-term stability, controllers should typically operate below 80% heap utilization during normal operation.
Search and Filtering
A search field is available for quickly locating controllers, inputs, outputs, or configurable I/Os by name.
The filter option allows controllers to be displayed based on their connection status:
-
All Controllers
-
Connected to Cloud Broker
-
Connected to Local Broker
-
Offline
Summary
The Controllers section provides a comprehensive overview of all PIERRE controllers within a project. It enables installers, integrators, and service personnel to monitor connectivity, manage device configuration, perform diagnostics, and track system resource utilization, ensuring reliable operation of the entire PIERRE Wired installation.
PIERRE Controller information
General Information
Controller View in the PIERRE Partner Application
Clearly displays the controller name, connection status, number of programmed I/Os, and controller usage.
Controller order: The controllers can be reordered according to the user's preference.
To change the position of a controller, press and hold the two horizontal lines on the right side of the controller and drag it up or down to the desired position.
The new order is automatically saved when the controller is released in its new position.
Search – Enter the controller name or I/O name in the search field to quickly find the desired controller or I/O.
Filter – Controllers can be filtered by their connection status:
- All
- Connected to Cloud Broker
- Connected to Local Broker
- Offline
Edit controller informations
Log – Enables verbose-level logging on the serial port of the PIERRE controller.
The log is not displayed in the application and is not uploaded to the cloud. A physical connection to the controller's serial port (USB/UART) is required to access the log. For normal operation, it is recommended to keep verbose logging disabled, as continuous logging places additional load on the controller.
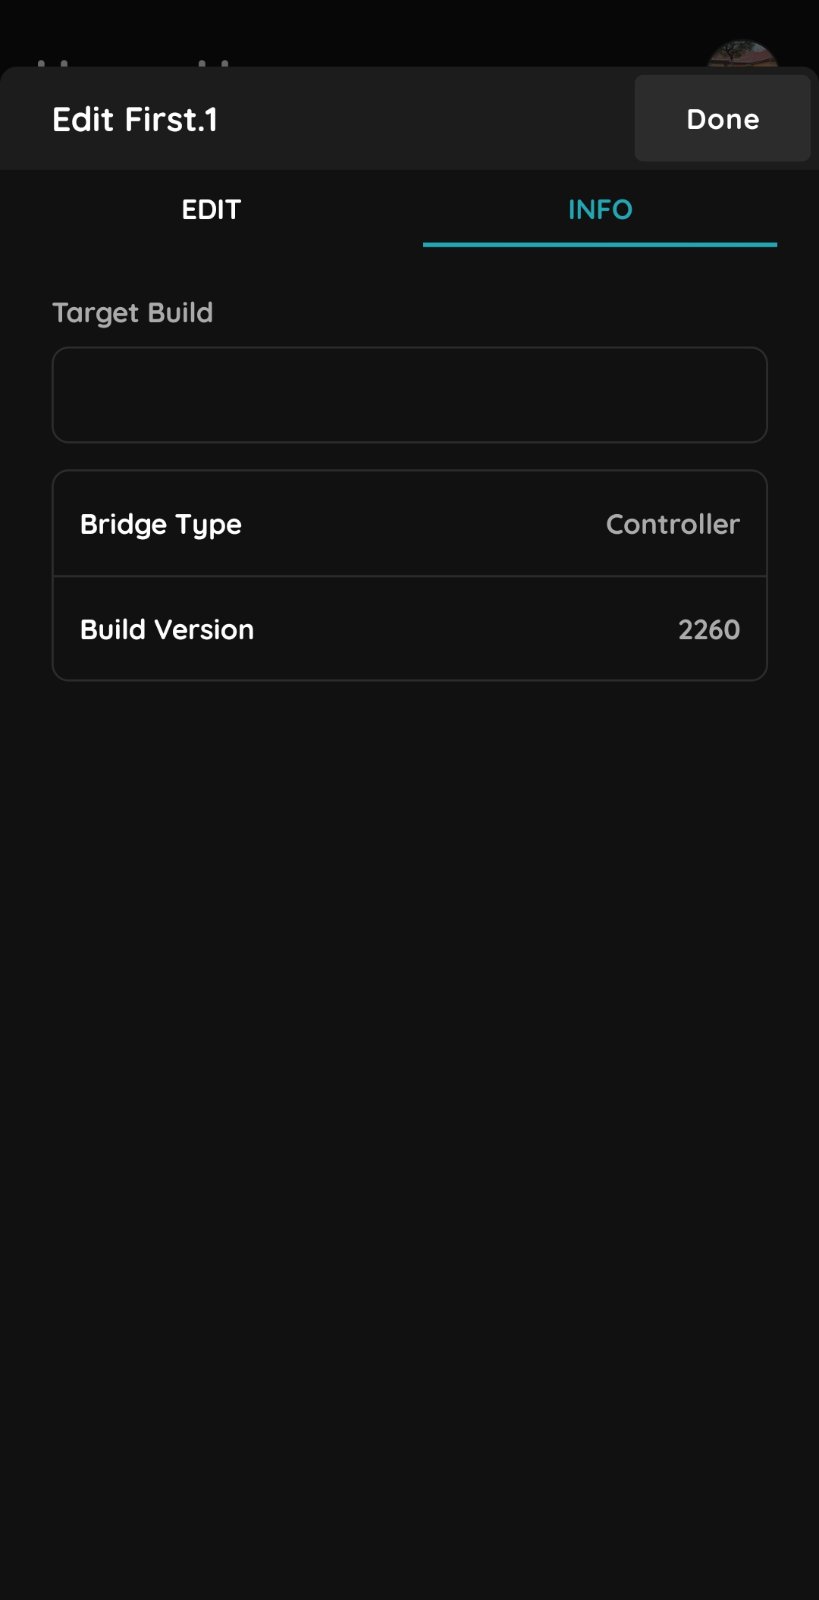
Information
This tab displays the following controller information:
- Controller type
- Build version